Discover Ecommerce Opportunities With Google Analytics
Learn how to use Analytics for your store

As a Search Marketing Specialist and Team Lead in Volusion’s SEO department, my main job function is managing marketing campaigns and training employees to improve organic traffic and revenue for our clients. Clients utilize our services as they value professionals leading online marketing strategy that opens their schedules to run daily business functions. At some point in every consultation call, the client will ask, “How will we gauge the success of your work?” While there are many website reporting tools to choose from, we use Google Analytics.
Released over ten years ago, Google Analytics is the most popular web analytics service in use today. It's a free tool that collects a staggering amount of valuable information about the who, what, when, where and even how visitor traffic reaches and interacts with your site. Google Analytics, affectionately referred to as “GA” by the Volusion Services team, is a JavaScript based reporting program which is ideal for obtaining traffic data about real life customers.
Without Google Analytics’ historical website trends and revenue data, online business owners might be missing information that's helpful for identifying opportunities and creating a successful marketing strategy.
Without Google Analytics’ historical website trends and revenue data, online business owners might be missing information that's helpful for identifying opportunities and creating a successful marketing strategy. Google won't hit you over the head with a million dollar opportunity report, but tracking visitor trends using Google Analytics and knowing which reports are relevant is beneficial for any owner of a website. In the rest of this post, we’ll cover some of our favorite reports. To make it easy to locate the specific reporting section, the heading of each paragraph will include the path you take once logged into GA, where applicable.
Who is Visiting the Site?
Business owners and marketing professionals must understand the target market to be successful with any marketing campaign. Sometimes our clients are surprised to learn their traffic is more male than female or from the millennial generation instead of baby boomers. Google Analytics’ Audience tab includes many reports that can be broken down for more specific insights. You can learn about visitor demographics, interests, physical location, behavior, browsing device and more. If this is your first time in GA and you’re looking for general insights, set a wide reporting date range using the date function in the upper right corner. The New vs. Returning report will let you know if your traffic is from brand new customers or if traffic is returning.
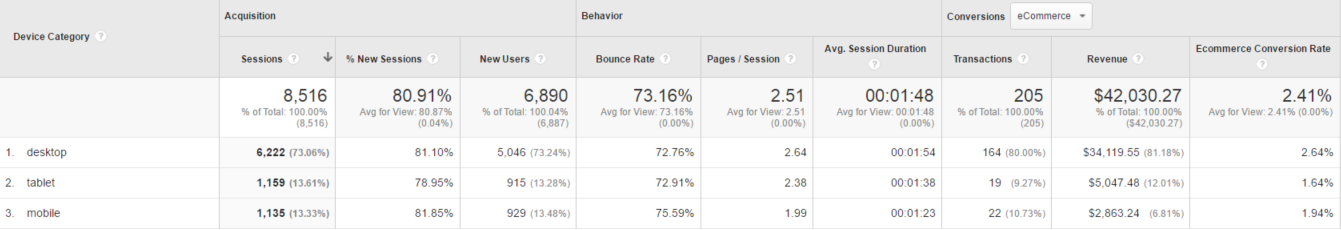
Generally, mobile traffic will not convert as high as desktop.
One report that can say a lot about site design and development is the Mobile> Overview tab. Here, all site traffic will be broken down by browsing device: either desktop, tablet or mobile smartphone. Looking at the below screenshot, the majority of this site’s traffic uses a desktop computer (73%) while tablet and mobile phones each account for 13.5%. The far right column records the conversion rate for each channel. While the mobile conversion rate is approaching 2% – which is an acceptable percentage and not too far off from the desktop rate – this client could consider a mobile friendly responsive template if mobile or tablet traffic was suffering. Generally, mobile traffic will not convert as high as desktop so this was not an alarming example.
GA’s Audience tab will ensure you know who is visiting your site, allowing you to create products and promotions that will resonate with them. To get the most out of Audience reports we recommend enabling "Demographics and Interest Reports" in the **Admin>Property Settings** tab.
What are People Looking at?
Reporting>Behavior
After we know who is visiting a site, it’s important to understand what pages users are visiting and where they spend their time. GA’s Behavior tab is the best place to learn about top preforming – and low-performing – pages. As Search Marketing Specialists, our goal is for visitors to find what they are looking for on your site and make a sale. Open Behavior>Site Content> All Pages for a list of most frequently visited pages. Are those pages your top products you are trying to push? If not, the site may need to restructure categories or optimize pages with more defined keywords. By default, GA looks at All Users, but you can edit segments at the top of the page to study Organic, Paid, Mobile or Direct Traffic. You’d be surprised how a page may do really well with one traffic source but not another.
You’d be surprised how a page may do really well with one traffic source but not another.
Pop down to the Site Content>Landing Pages and Exit Pages to see the top entry and exit pages customers encounter. Make it a priority to address these pages, working to improve landing pages with few visits or low revenue, and fix potential issues with common exit pages. Is something broken on that top exit page or is pricing not competitive enough?
When Did Traffic Come to the Site?
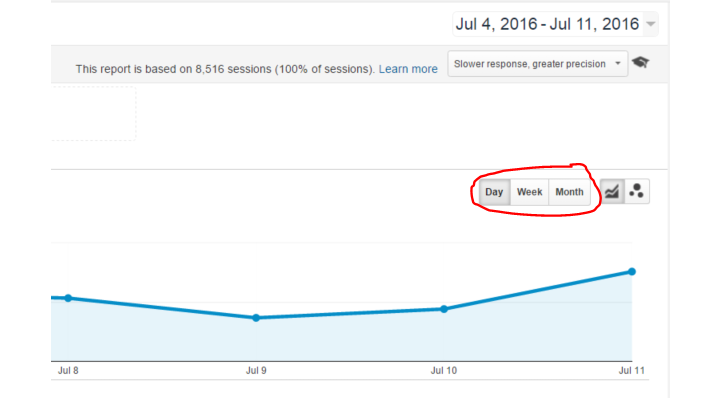
Each of Google’s reports include begin and end date calendars in the upper right of the screen to modify reporting range. Use the dates to filter data and compare using GA’s compare to “previous period”, “previous year” or a custom date range. If you are looking at a wide date range and want to better visualize the numbers, use the Day, Week, and Month buttons below which will adjust the X axis data width to make better sense of the numbers:
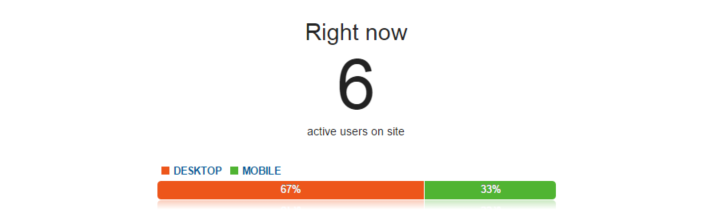
If you want a live report of the traffic on the site at any given time, open the Real-Time reporting tab.
How did traffic reach the site?
Reporting>Acquisition>All Traffic> Channels
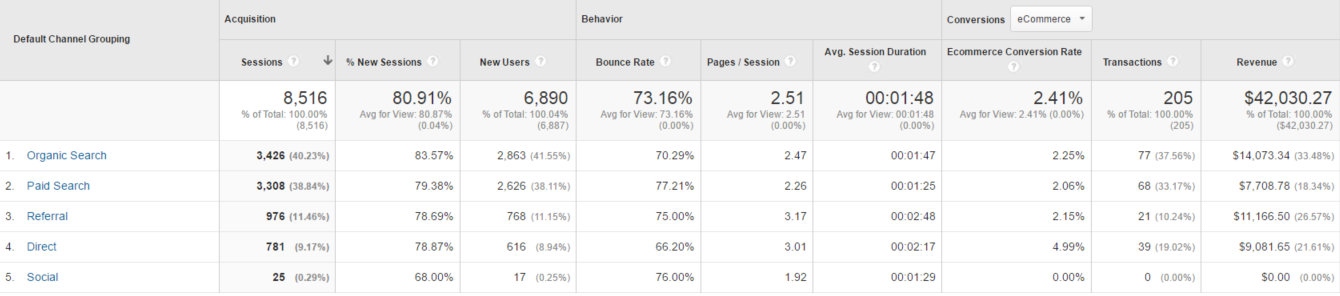
Understanding the channel a visitor used to reach your site – and how that compares to other channels – is one of the most valuable reports. In the first column of the below screenshot, you’ll see organic search is responsible for the majority of traffic, followed by paid search, referral, direct and finally social media traffic. This is great to see, as organic traffic is free and means Google and other search engines understand the value of this particular website. Organic traffic is also responsible for the most amount of new users to the site, number of transactions and overall revenue as well.
If you rely on Volusion’s basic dashboard reporting, you might benefit from studying the traffic and revenue trends by traffic source.
Direct traffic is not very high on this site, but customers who type in the domain name or have the site bookmarked convert at a rate almost double that of organic search. If you rely on Volusion’s basic dashboard reporting, you might benefit from studying the traffic and revenue trends by traffic source. Should you invest in a different traffic source or double down on your efforts on a top performing channel? Without an ecommerce enabled Google Analytics profile, your guess is really as good as ours.
Where is Traffic Coming From?
The literal answer to this question is found under the Audience>Geo>Location tab, which includes a worldwide map with reported traffic by location. Hopefully by now you understand visitors reach a site from various sources, at different times, to different pages and behave differently on different devices. Once you have installed Google Analytics and the ecommerce script begin to explore the various reports. If something doesn’t add up, chances are you found your site’s next opportunity for improvement.
If you’d like to learn more about custom Dashboards that make it easy to find favorite GA sections in one place, check out this blog. It even includes a few Dashboards you can import to your GA.
If this is was your introduction to Google Analytics, you will not be an expert overnight. However, as you become more familiar with Google Analytics over time, you will learn more about your customers, industry and your site as a whole.