8 Google Shopping Metrics to Pay Close Attention To
Your Google Shopping campaigns are underway. But how do you know if they're really performing at their best? Examine these eight Google Shopping metrics to gauge their performance and see what you should improve
When it comes to Google Shopping campaigns, Google does a great job of providing you with an abundance of information—but all that information can be overwhelming. When you first open your Google Shopping campaign, there are plenty of columns available showing metrics that tell you how your products are doing. But what do they all mean, and which ones are important to pay attention to? Below, we walk through eight metrics that will help you navigate the success of your campaigns and individual products.
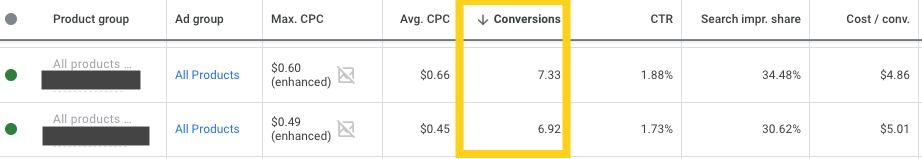
1. Conversions
A conversion is, of course, an action that is counted when someone interacts with your product listing and then takes the action you have defined as your conversion. This action is determined when you are setting up your campaign. Typically, an ecommerce store focuses on sales as a conversion action for Google Shopping campaigns.
Conversion = # of Predetermined Actions Taken
If conversions are low, there are a few things you can try. Implementing competitive pricing, whether that be sales or free shipping, can make your product stand out from the crowd. You can also raise your CPC (more on that below) for a better competitive advantage. Using quality photos, titles, and descriptions can also help improve your conversion rate.
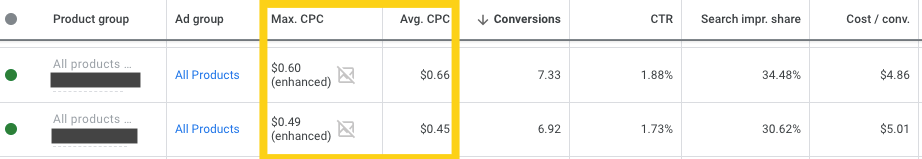
2. Cost Per Click (CPC)
The cost per click is the amount of money your business pays for each click on your ads. The amount can vary, as CPC is determined by bidding on certain words auction-style. Depending on your industry, CPC bidding can get quite expensive. Having a healthy Google Shopping budget will allow you to set higher bids and make your products rank higher than competitors.
The Average CPC shows the average amount you are paying for a click on your product. Meanwhile, the Max CPC shows the highest price you’d be willing to pay for a certain product. Setting this ceiling can prevent you from overpaying on product ads.
CPC = Cost / Clicks
You can lower your CPC by using negative keywords, which prevent your products from being shown for unrelated queries.
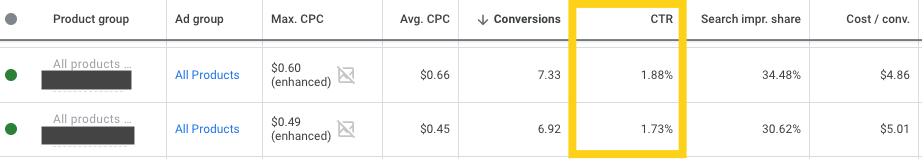
3. Clickthrough Rate (CTR)
The clickthrough rate is a ratio that demonstrates how often people see your listing and proceed to actually click on it. By monitoring the clickthrough rate of your ads, you can gauge the effectiveness of the product ad itself.
CTR = Clicks / Impressions
If this metric is low, try making some changes to the ad, such as improving the product title and description.
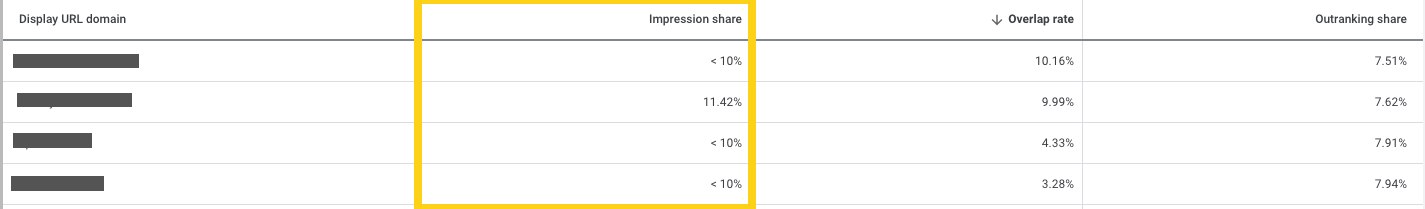
4. Impression Share (IS)
The impression share is a comparison metric that shows you the percentage of impressions your listing receives compared to the total number of impressions your listing could get. This metric is a good way of measuring how your ads compare to that of your competitors.
Impression Share = Number of Impressions / Estimated Number of Impressions Eligible For
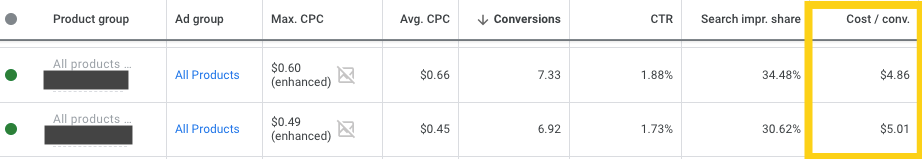
5. Cost Per Conversion
The cost per conversion is an average calculation of how much you pay for each conversion that occurs. This number should ideally be lower than the cost of your product. When examining this metric, think to yourself: how much is a sale worth to you?
Cost per Conversion = Cost / Conversions
To improve your impression share, try increasing your budget or bids. Your budget controls how often your ad is shown, and increasing your bid can improve the likelihood that your ad will be shown.
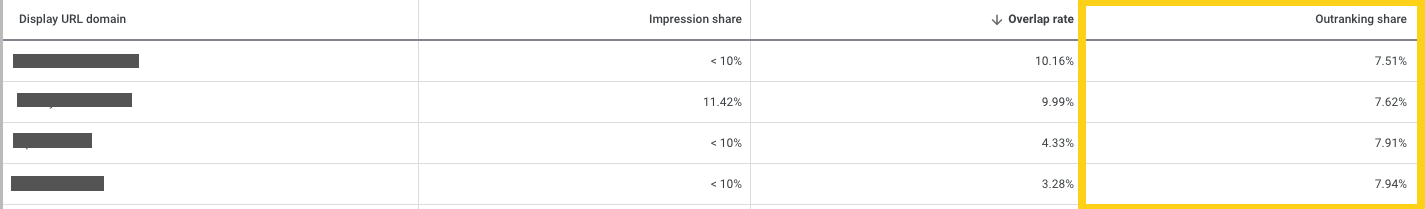
6. Outranking Share
The outranking share is another comparison metric that shows you how often your ad ranked higher in the auction than another advertiser’s ad. It can also mean that your ad showed up in search when another advertiser’s ad did not.
Outranking Share = # of Times Ad Outranked Competitors’
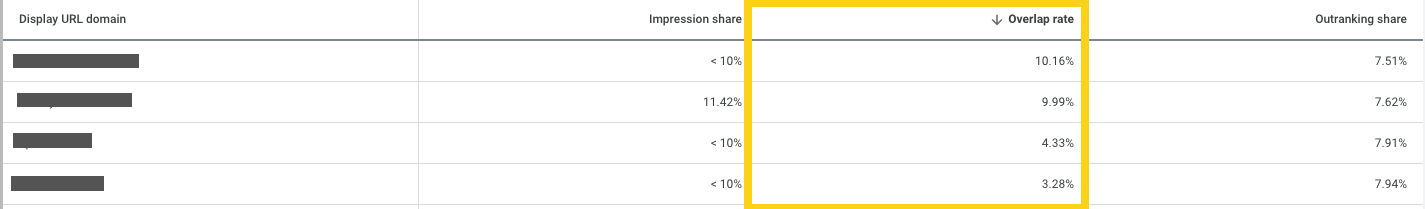
7. Overlap Rate
Another comparison metric, the overlap rate shows how often another advertiser’s ad received an impression at the same time that your ad received an impression. For example, if you have an overlap rate of 30%, that means 3 out of 10 times your ad is shown, an ad from the other advertiser is also shown. Understanding your overlap rate will help you understand where you stand in comparison to your competitors.
Overlap Rate = (Times Ad Overlapped Competitors’ / Total Times Ad Shown) x 100
8. Return on Ad Spend (ROAS)
The return on ad spend shows how much you spend on the campaign vs. how much revenue the campaign brings in. Essentially, this metric shows you how much revenue your shopping ads bring in for every $1 spent on the advertisements themselves. By monitoring this metric, you will be able to tell if you’re breaking even, and by how much.
ROAS = Revenue / Ad Spend
There are quite a few ways to improve your ROAS. Two key items to look at would be your products and your bidding strategy. Setting your bid strategy to “manual bidding” can help increase your ROAS by giving you more control over how you’re spending your money instead of letting Google decide how to spend it. Making sure your product descriptions, photos, and titles are optimized will also increase this metric since your product will be showing on more relevant queries.
Note: This metric is not available from Google—you must calculate it yourself.
In Conclusion
While all metrics serve their purpose, these eight metrics will help you evaluate and move forward with your Google Shopping campaign strategy. If you need a step-by-step guide on setting up a Google Shopping campaign, check out this blog post!