In preparation for our upcoming Google Analytics webinar, one of our Marketing Specialists will guide you through setting up your own personalized Analytics dashboard.
“Starting a campaign without having access to analytics is marketing suicide.” – Richard Stokes
Enough said: if you aren’t using Google Analytics for your online store, you should be.
Analytics is an extremely useful tool imperative to any online store, no matter what the industry is. You can learn vital metrics about your website and customers with this free tool that you would have a very difficult time finding otherwise. Later this month, Volusion marketing consultants will walk storeowners through analyzing and digging into Google Analytics data in our "Welcome to the Metrics" webinar, but beforehand we wanted to provide some quick and free tools you can use right now to understand your store better.
Below, we’ll show you how to set up your own custom starter dashboard and then give you three free Volusion-created dashboards. While the dashboards may seem overwhelming at first, you’ll love how they eliminate the work of data mining through huge Excel files and because they provide information right in front of you, all in one place.
But first, what is a Google Analytics dashboard?

A dashboard is a visual overview of your data using various widgets. Each dashboard can have up to 12 widgets (or data points), which gives you the ability to monitor metrics in one place giving you the power to know the status of your business at first glance. Not only that, but you can customize which widgets show and those that don’t. This is incredibly powerful.
How to create your own Google Analytics dashboard
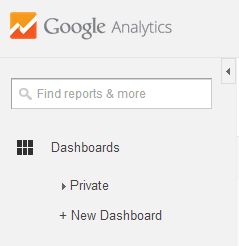
Once you have logged into your Analytics account, click on the left-hand navigation link called “Dashboards”. This will give you the options: "Private" and "New Dashboard." Select new dashboard and you can start customizing!
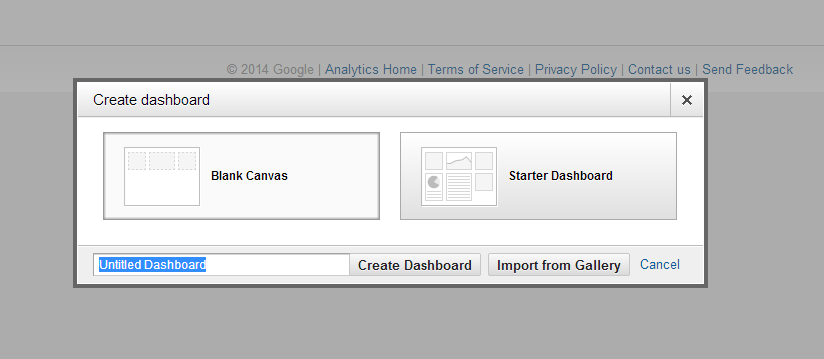
If you select “New Dashboard” a box will appear giving you the options to start with a blank canvas or a starter dashboard. We recommend the starter dashboard because it already has valuable widgets installed and you have the option to customize from there.
The Starter Dashboard default widgets include:- New users – The percentage of total users that are visiting the website for the first time
- Users – The total of users that interacted with the website
- Sessions – The number of times users are actively viewing the website
- Sessions by browser – The number of times all users are actively viewing the website at a time segmented by which internet browser they are using
- Average session duration – The average time a user stayed on the website
- Bounce rate - The percentage of single-page visits (i.e. visits in which the person left your site from the entrance page without interacting with other pages)
- Goal completions – Goals are defined by you in the Admin tab in the top navigation. This shows the number of completed goals which could be a transaction, signing up for a newsletter or any other action you define it by
- Revenue - The total revenue from web ecommerce. Depending on your implementation, this can include tax and shipping
How to customize your widgets
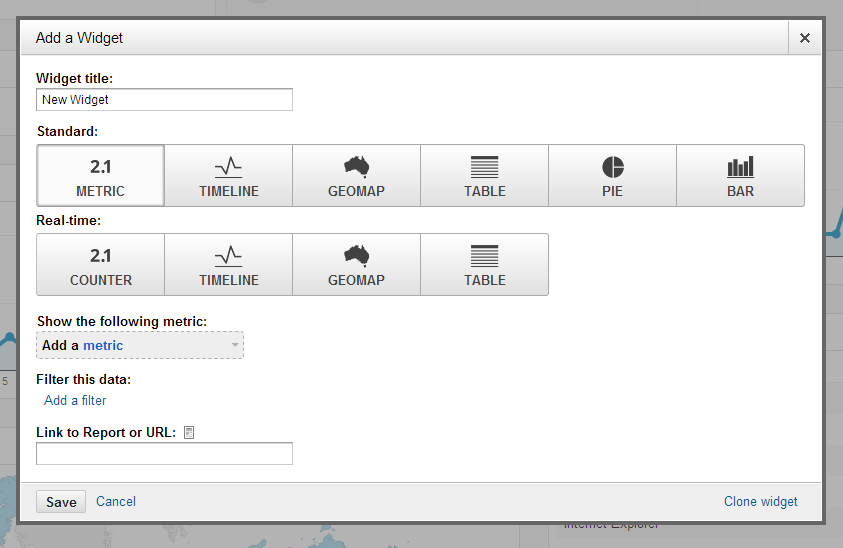
Now that you have a good starting point, you may want to add some custom widgets to your dashboard. In order to accomplish this click the “+ Add Widget” button at the top left of your starter dashboard navigation. This will open up a popup allowing you to name the widget, pick how the information will be displayed and add a metric from Google Analytics. Your widget it will immediately appear in your dashboard once you save it.
Additional widgets we recommend:
- Transactions – The number of purchases through the website
- Conversion Rate – The percentage of sessions that have completed a transaction
- ROI - Return on investment, meaning the percentage of money earned back as profit compared to the initial investment
- Cost – The total amount you paid for your ads
- CPC - Cost-per-click is the average cost you paid for each click on your ad
- General ecommerce analytics dashboard
- General organic traffic dashboard
- General paid search traffic dashboard
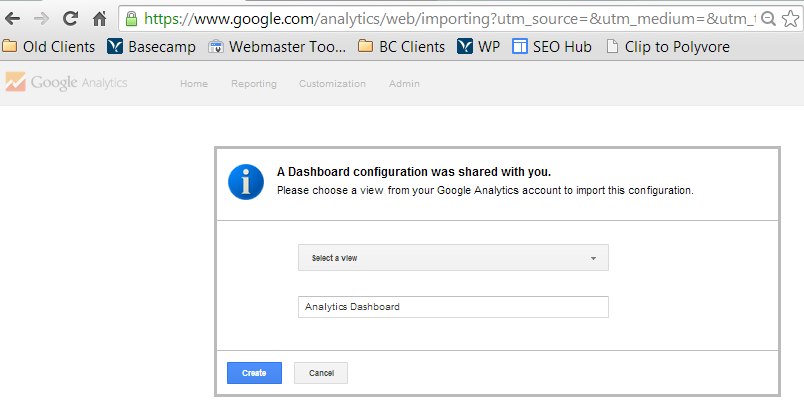
Scroll to your website, click the “Create” button and voila! It will appear in your profile. To find our custom dashboard simply select it in the left hand navigation from Dashboards > Private > (The name of the dashboard).
-Natalie Stambro, Marketing Consultant


